
The Dashboard
The Dashboard
Before you begin: Make sure you are logged in to the Loving Loyalty Manager. If you have not logged in yet, see How to log in and reset your password.
What is the Dashboard?
The Dashboard is the first page you see after logging in. It gives you a quick summary of your location's performance for the current week.
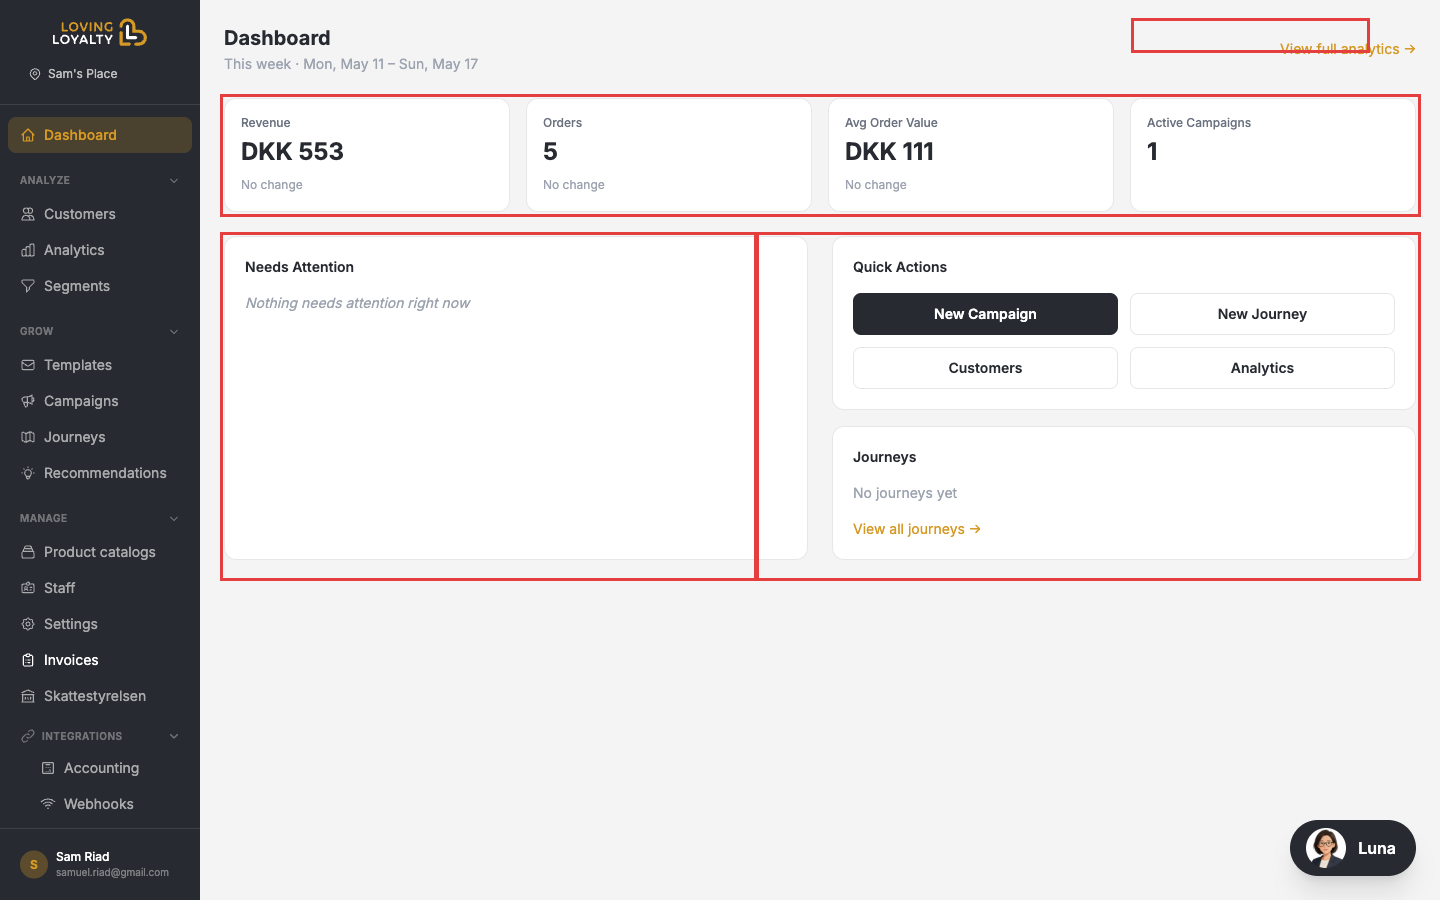
Key metrics
- Revenue — Total sales revenue for the current week.
- Orders — Number of orders placed.
- Avg Order Value — Average spend per order.
- Active Campaigns — Number of campaigns currently running.
Each metric shows a comparison to the previous period.
Needs Attention
Highlights items that require action — for example, campaigns that have stopped or journeys that failed. If everything is running smoothly it shows "Nothing needs attention right now".
Quick Actions
- New Campaign — Create a discount campaign.
- New Journey — Build an automated customer journey.
- Customers — View your customer list.
- Analytics — Open the full analytics report.
Journeys
The bottom of the Dashboard lists your most recent active journeys. Click View all journeys to manage them, or View full analytics → in the top-right to open the detailed analytics report.