

 Dansk
 Svenska
 Deutsch
 Norsk bokmål
Read your analytics
Analytics is where you look at how the shop is doing: revenue, orders, what sells and
who sells it. It is the first page you land on after signing in, under
Analyze → Analytics.
Choose the period first
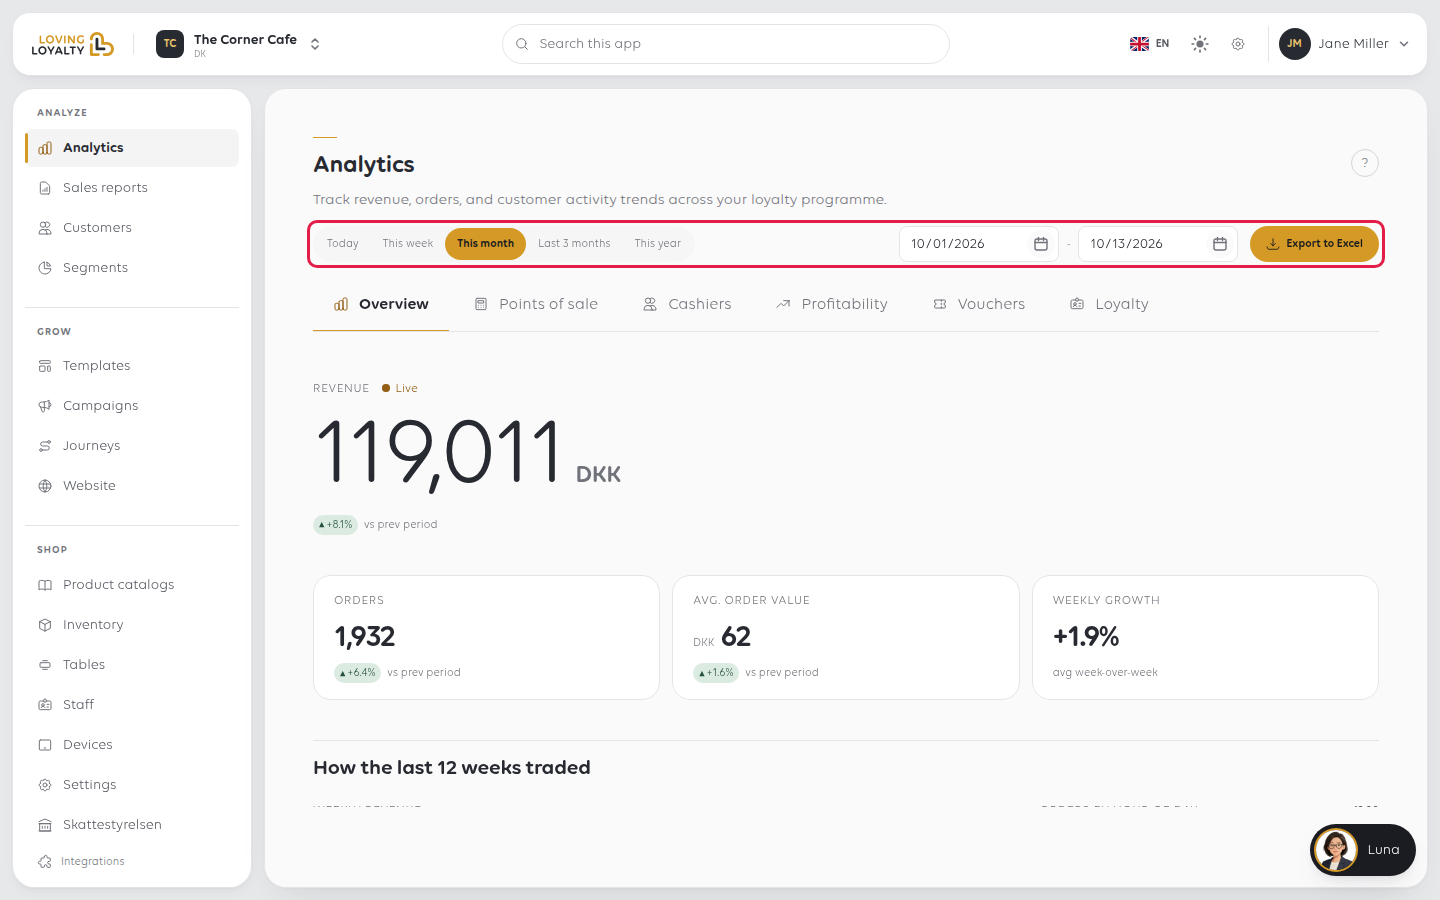
Everything on the page covers one period, so set it first. It starts on This month.
Today, This week, This month, Last 3 months and This year are one tap
each, or set any range in the two date boxes beside them.
A range that reaches today is live: it shows Live and refreshes every 30 seconds
while the page is open, so new sales roll in. Today swaps the large Revenue
figure for Today so far, which says how far you are ahead of or behind the same
weekday last week at this time, with orders by hour against that day.
Most misreadings of this page come from comparing a number from one range with a
number from another.
What the sections tell you
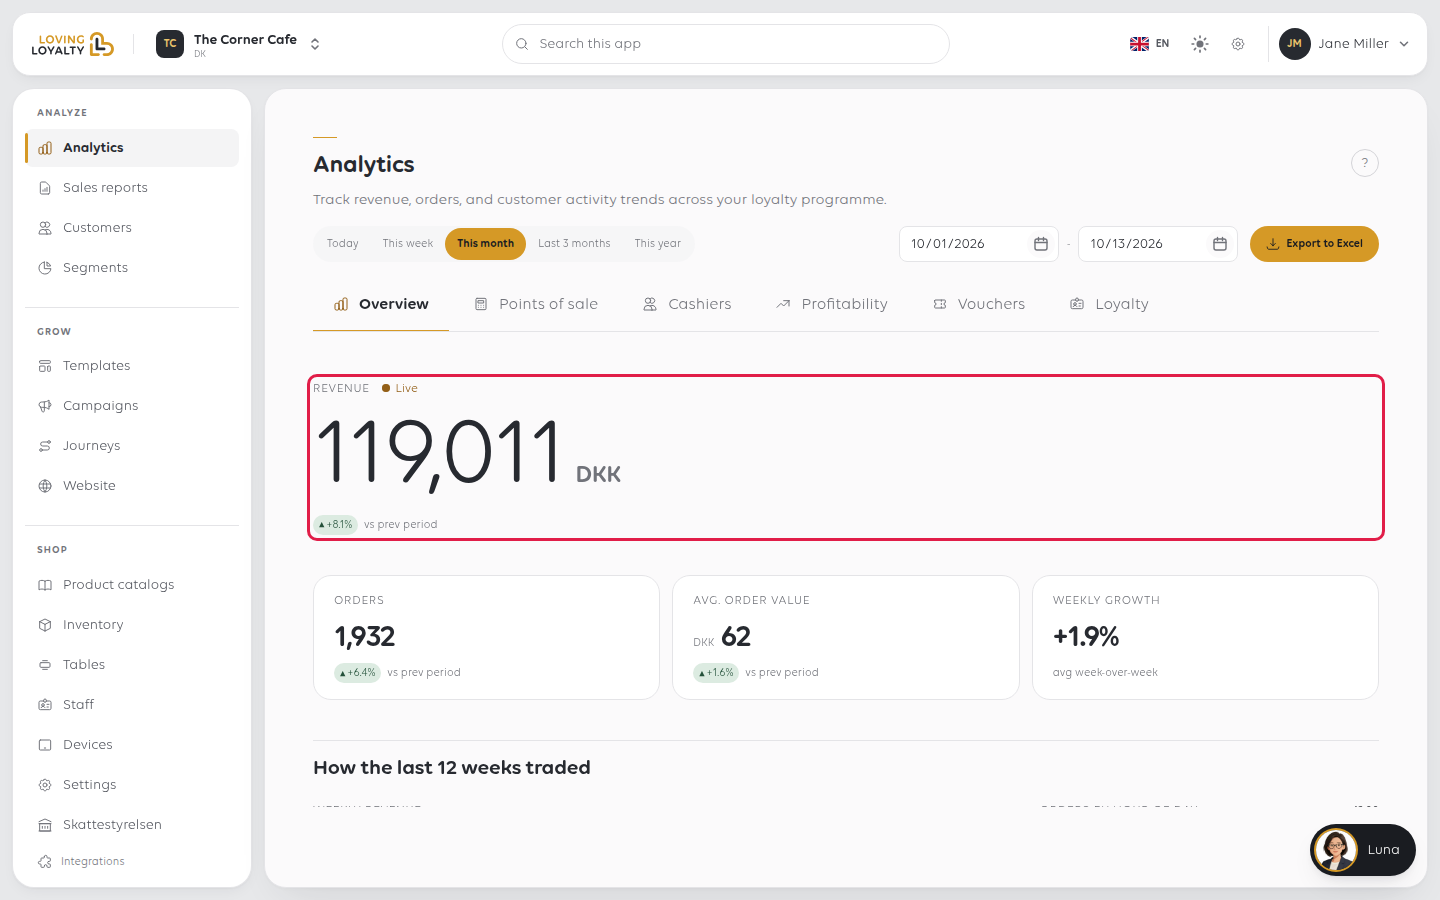
The page is split into tabs. Overview leads
with a large Revenue figure, then Orders, Avg. Order Value and Weekly
Growth, each against the previous period so you can see the direction as well as the
size. Its charts sit under How the last 12 weeks traded and What sold, and how
it was paid.
| Tab | Answers |
|---|---|
| Overview | How the period went overall, and how it compares |
| Points of sale | Which till or channel the money came through |
| Cashiers | Who served it |
| Profitability | What was left after cost. It opens on Cost coverage, the share of your revenue with costs entered; Add costs jumps to the items still missing one. See Build a product catalogue for where cost comes from |
| Vouchers | What was issued and what was redeemed |
| Loyalty | How your programme is doing |
Take the figures away
Export to Excel downloads a spreadsheet for the period you have chosen, not
everything.
For a fixed record of a finished period, use a sales report instead: those are kept
and do not change. See Find your sales reports.
If something goes wrong
| What you see | What it means | What to do |
|---|---|---|
| No orders in this period | The period has no sales, or it is the wrong shop | Widen the range, then check the shop name in the top bar |
| Figures differ from the till's Z report | Analytics covers a date range; a Z report covers a cash balance | They answer different questions. See Close the shop with an X or Z report |
| Profitability is empty, or Cost coverage is low | Items have no cost recorded | Click Add costs, or set cost on the product. See Build a product catalogue |
| A cashier is missing | Nobody sold under that name in the period | Check the range, and that they used their own PIN |
Was this article helpful?
Thanks for your feedback!